

HWMonitor for Windows
Monitor your PC’s temperatures, fan speeds, voltages, power, and other hardware sensor data in real time.
Software Information
Available: ARM64
HWMonitor Screenshots
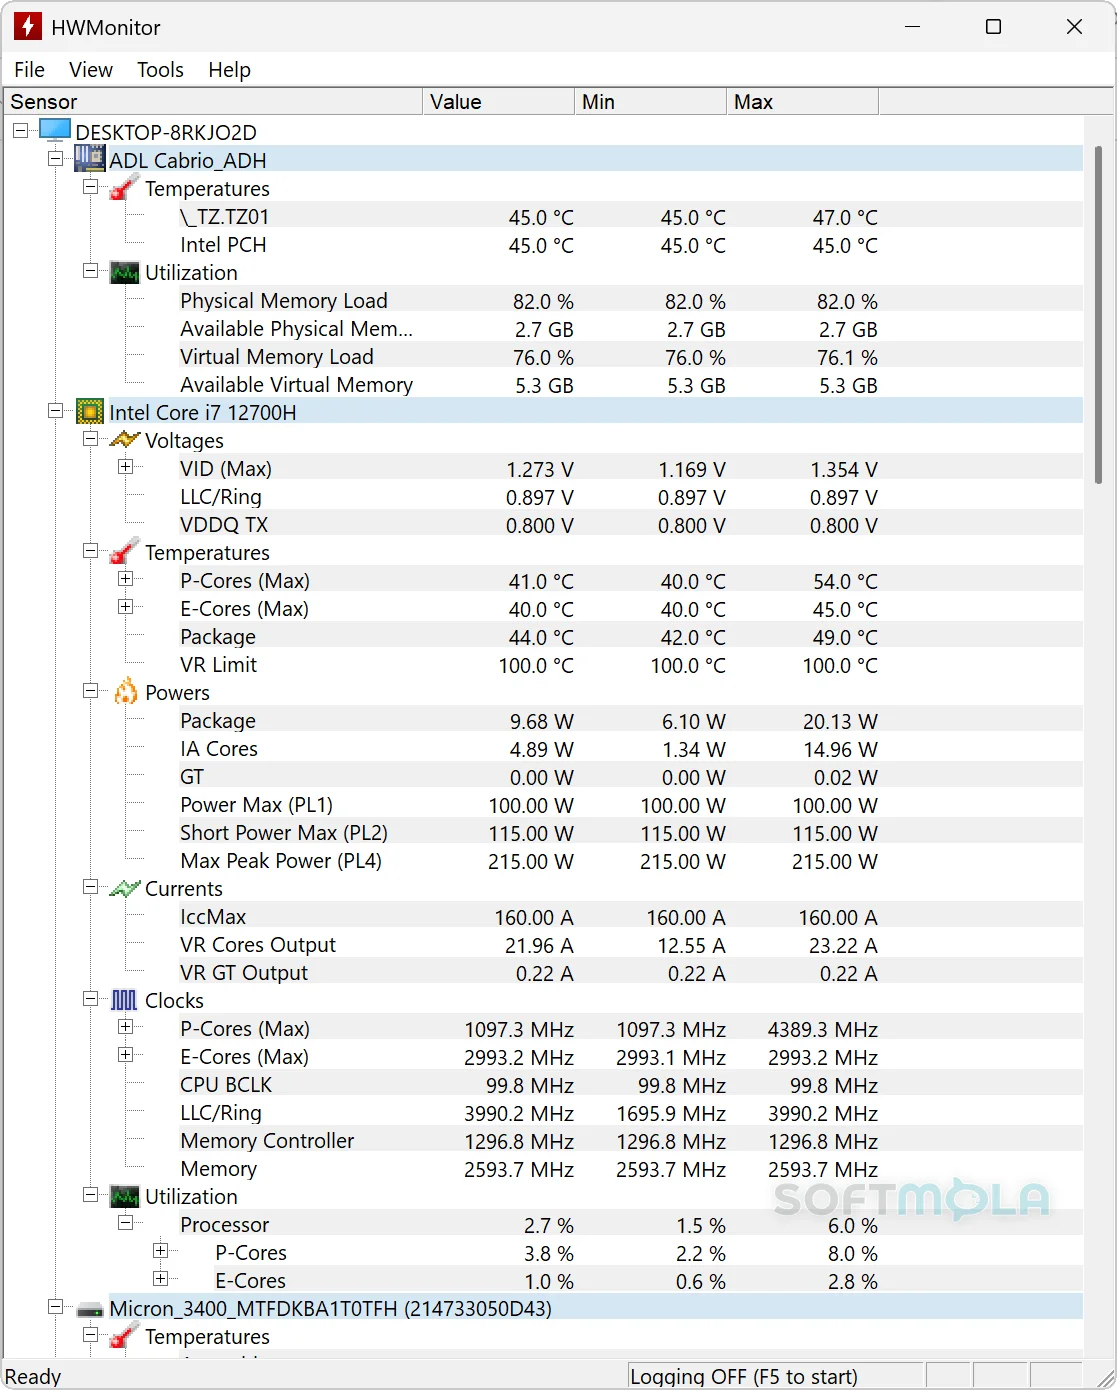
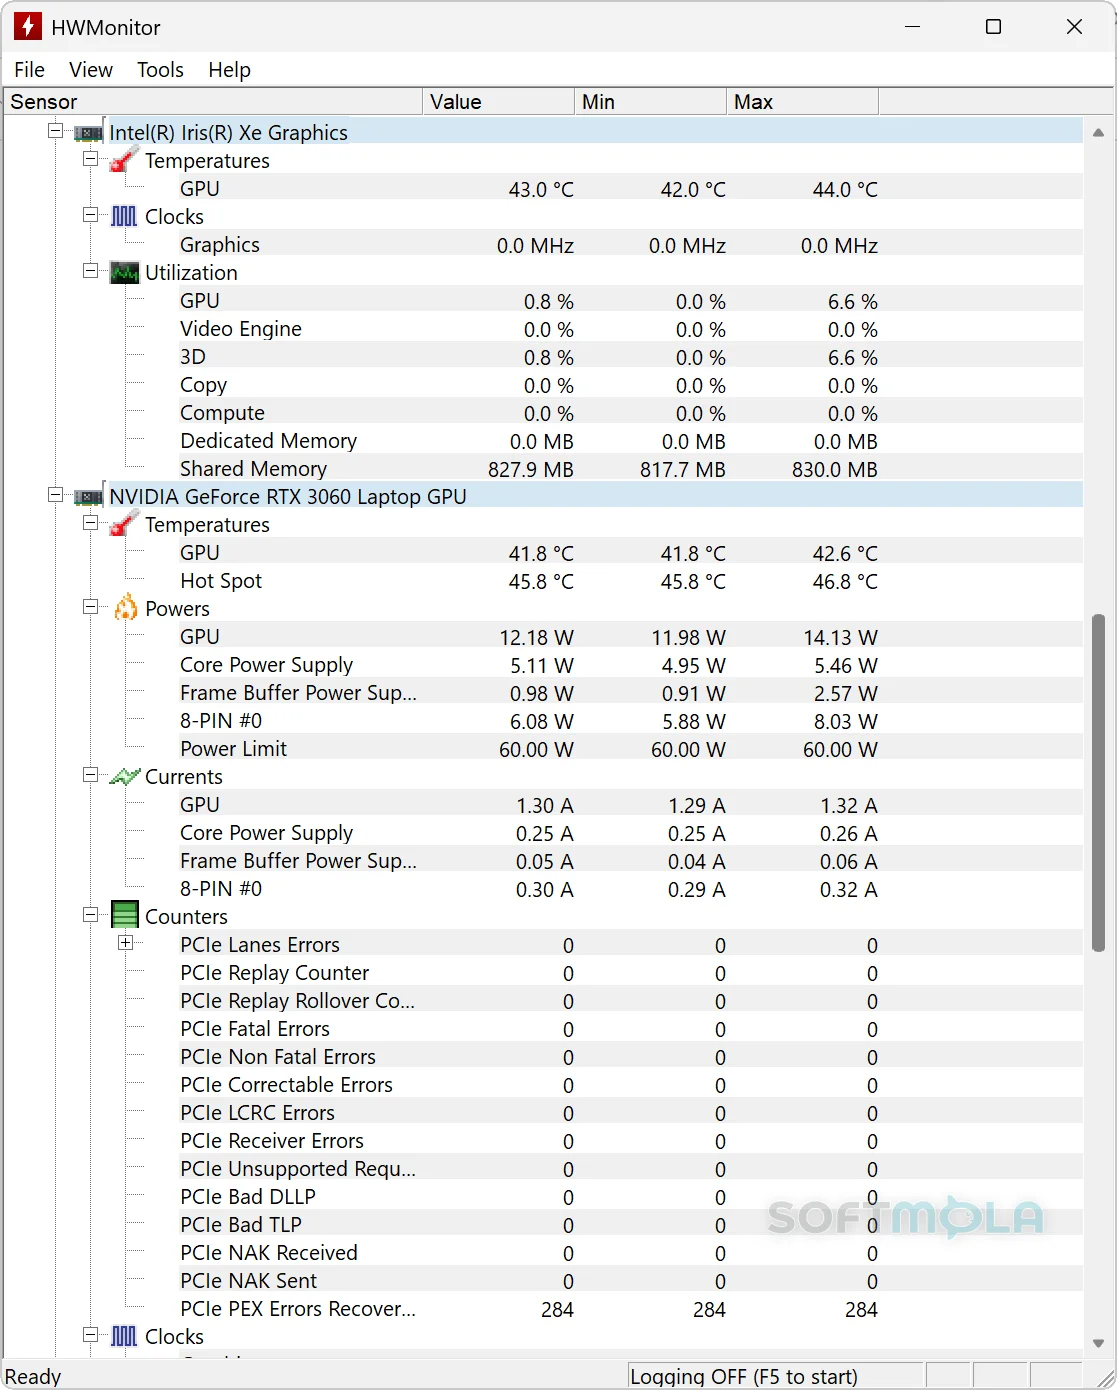
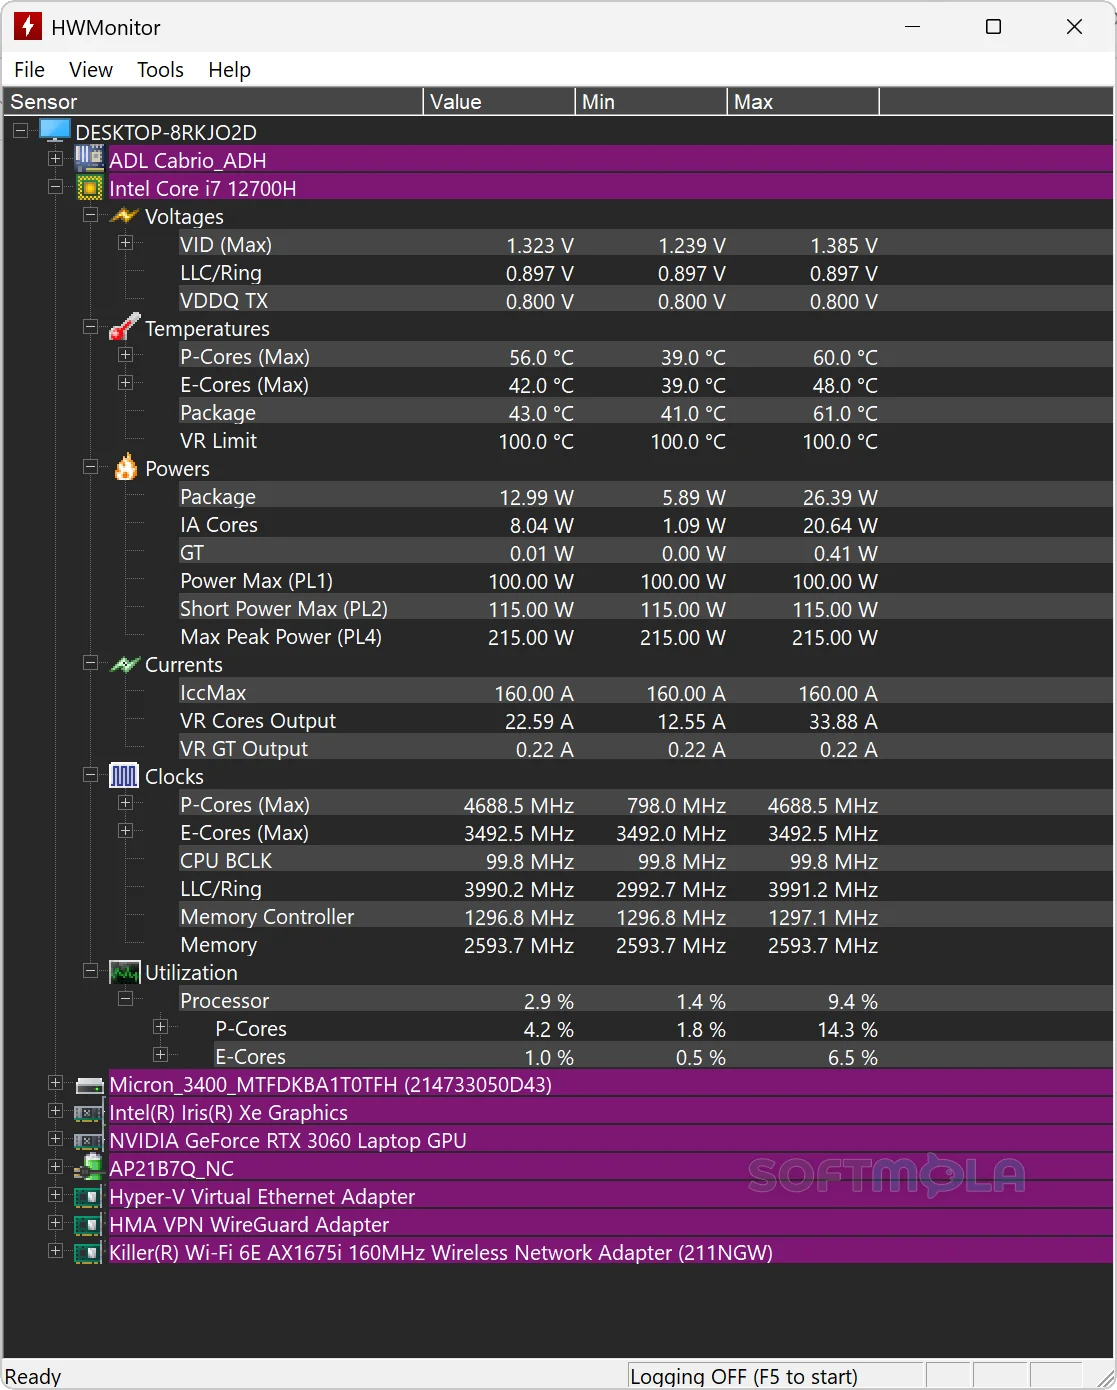
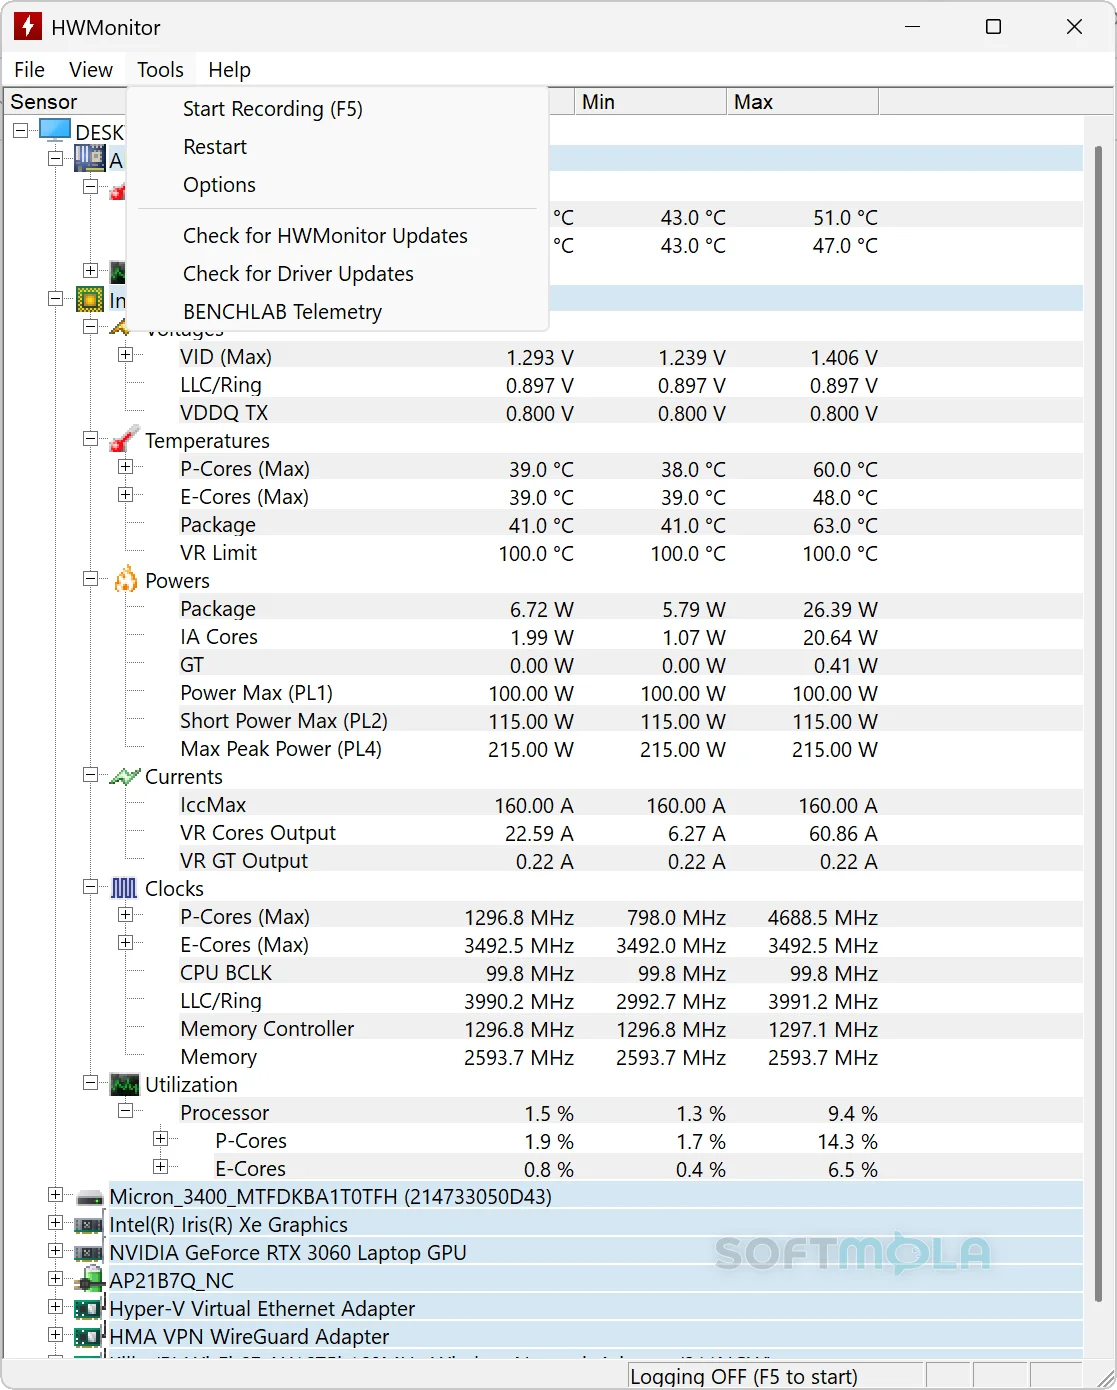
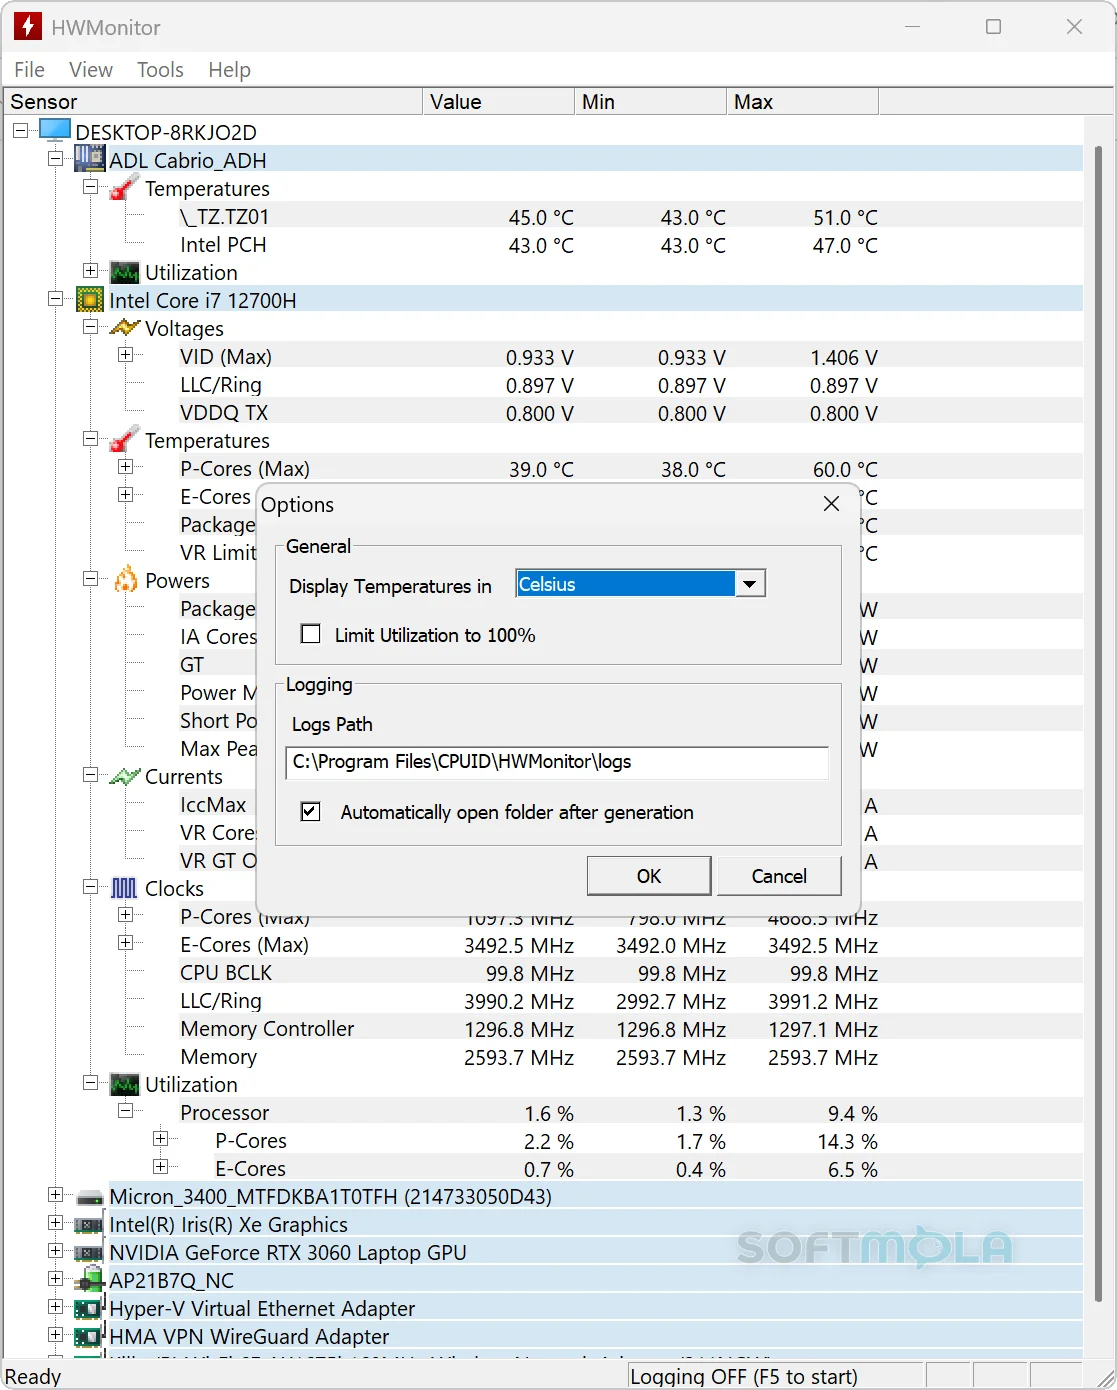
Table of Contents
HWMonitor is a hardware monitoring utility for Windows that gives you a direct view of temperatures, voltages, fan speeds, power readings, clock speeds, utilization, and other health data reported by your PC’s sensors. Developed by CPUID, it is designed for users who want to understand what is happening inside a desktop or laptop without installing a large system-management suite.
The standard HWMonitor for Windows is available as freeware, with both installer and portable ZIP options. CPUID currently supports Windows x86/x64 as well as Windows on ARM64, making the utility relevant across traditional Intel and AMD PCs and newer ARM-based Windows systems. As of August 2026, the current x86/x64 release is HWMonitor 1.66, published on July 22, 2026.
For PC builders, gamers, overclockers, troubleshooting technicians, and anyone investigating excessive heat or unusual fan behavior, HWMonitor provides a convenient central view of sensor information that would otherwise be scattered across firmware utilities and hardware-specific applications.
HWMonitor Review
HWMonitor has a deliberately focused purpose: read the sensors available in a Windows PC and organize their measurements in one place. Its coverage extends beyond basic CPU temperature readings. CPUID lists support for CPU- and GPU-level monitoring, motherboard monitoring chips, memory modules equipped with thermal sensors, storage devices through S.M.A.R.T. data, batteries, and additional compatible hardware. Depending on the system, readings can include temperatures, voltage, electrical current, power consumption, utilization, fan speed, and clock frequency.
That broad sensor coverage is the main reason HWMonitor remains useful. A gaming PC experiencing sudden fan noise, for example, can be observed while a game or workload is running to see whether CPU or GPU temperatures are increasing sharply. Someone diagnosing cooling performance can compare current readings with the minimum and maximum values recorded during a session. Power and clock information can also add context when investigating throttling or unexpected performance behavior.
The interface favors visibility over visual polish. Hardware and sensors are arranged hierarchically, allowing users to expand the components they care about instead of navigating between several separate monitoring screens. Recent releases have also modernized the presentation. HWMonitor 1.64 introduced new themes and real-time graphs, while version 1.66 added a transparent graph window. These additions make the program more useful for watching a changing value instead of relying entirely on rows of numbers.
HWMonitor has also become more capable as a logging tool. Version 1.62 introduced CSV logging, providing a practical way to preserve readings for later examination. This is particularly useful when a problem occurs intermittently. Instead of trying to watch dozens of sensors continuously, a user can collect monitoring data during a workload and examine the results afterward.
Hardware monitoring software does have an important limitation: readings depend on the sensors exposed by the hardware and on the software correctly interpreting them. Not every motherboard, processor, GPU, storage device, or peripheral presents identical telemetry. An unusual value should therefore be treated as diagnostic information rather than unquestionable proof of a hardware problem. If a reading appears implausible, confirming it with a motherboard utility, firmware interface, or another reputable monitoring application is sensible before changing voltages or cooling settings.
Continued hardware support is another strength. CPUID has issued several HWMonitor updates during 2026, adding or refining support for new Intel and AMD processors, newer memory types, power supplies, monitoring devices, and graphics hardware. The July 2026 release specifically improved hotspot-temperature reporting for AMD Radeon RX 9000 GPUs, while the preceding 1.65.1 update corrected hotspot reporting on NVIDIA RTX 50-series GPUs.
Users should also distinguish the standard edition from HWMonitor PRO. The free HWMonitor provides the core hardware-monitoring functionality, while the PRO product adds features such as monitoring remote PCs or Android devices, sensor icons in the system tray, editable sensor labels, and more advanced logging and graph-generation options. CPUID states that the PRO edition uses the same underlying hardware-monitoring capabilities as the standard application, so paying for PRO is primarily about these additional management and presentation features rather than obtaining a different sensor engine.
For most home users who simply want to check temperatures, fan behavior, clocks, or power readings on one Windows PC, the standard edition should cover the essential task without introducing subscription complexity. HWMonitor PRO is more relevant when remote monitoring or its extra workflow features justify the additional cost.
HWMonitor is not a security application, repair utility, benchmark, or automatic optimization tool. It does not fix overheating, adjust cooling settings for you, remove malware, or guarantee that a component is operating safely. Its role is observational. That narrow scope can actually be an advantage: it provides hardware telemetry without trying to turn every reading into an automated recommendation.
Key Features of HWMonitor
CPU and GPU Monitoring
HWMonitor can read sensor information at both CPU and GPU level, bringing key measurements into a single interface. Depending on the hardware, this can include temperatures, utilization, clock speeds, voltages, power readings, and related telemetry.
These measurements are especially helpful when diagnosing thermal or performance problems under load. Watching how temperatures and frequencies behave while gaming, rendering, compiling code, or performing another intensive task can provide useful evidence when a PC becomes unusually hot, loud, or slow.
Temperature and Fan-Speed Tracking
Temperature monitoring is one of HWMonitor's most practical functions. The application can collect thermal readings from compatible processors, graphics hardware, motherboard monitoring chips, memory modules with thermal sensors, storage devices, and other supported components. Fan-speed information can also be displayed when the system exposes the necessary sensors.
Having these readings together makes it easier to investigate cooling behavior. A high CPU temperature alongside unusually low fan speed, for example, gives a user more useful context than either measurement would provide on its own. Sensor availability still depends on the specific hardware configuration.
Power, Voltage, and Clock Readings
Modern PCs dynamically change frequencies, voltage, and power use according to workload, temperature, and firmware settings. HWMonitor exposes many of these measurements where supported, helping users see how a system behaves beyond basic temperature figures.
This is valuable for enthusiasts evaluating an overclock or undervolt, but the readings should be interpreted carefully. Monitoring software reports what available sensors provide; it should not be used as the sole basis for potentially risky voltage or firmware adjustments.
Minimum and Maximum Monitoring
A useful monitoring session does not always require watching the screen continuously. HWMonitor tracks changing sensor measurements so users can examine the range reached while a workload was running.
This makes the program practical for quick thermal checks. You can start monitoring, run a game or demanding application, and then inspect how far relevant readings moved during the session. It is a simpler workflow than trying to catch a short temperature or power spike in real time.
Real-Time Graphs
HWMonitor's newer releases include real-time graph functionality, introduced with version 1.64 and further refined with a transparent graph window in version 1.66.
Graphs are particularly useful when the direction and timing of a change matter. A temperature rising gradually, a clock frequency repeatedly dropping under sustained load, or power fluctuating during a workload can be easier to interpret visually than through rapidly changing numeric values.
CSV Logging
CSV logging, added in HWMonitor 1.62, allows monitoring information to be retained for later analysis rather than existing only in the live interface.
The feature can help with intermittent issues or longer testing sessions. Saved data can be inspected after the workload finishes or processed in spreadsheet and analysis tools, making HWMonitor more useful for troubleshooting than a purely live sensor viewer.
Storage, Memory, and Battery Sensors
Monitoring is not limited to the CPU and graphics card. CPUID lists support for memory modules with thermal sensors, SSDs and hard drives through S.M.A.R.T., and batteries, alongside motherboard monitoring hardware and other compatible devices.
The exact information available varies considerably between systems, but broader component coverage can make HWMonitor useful on both desktops and laptops. Instead of opening a separate program for every component, users can check many of the available hardware-health readings from one location.
Support for Current Windows Hardware
HWMonitor continues to receive updates for newly released hardware. Recent 2026 versions added or improved compatibility with contemporary Intel and AMD processors, newer memory formats, selected monitored power supplies and accessories, and current-generation GPUs. The standard application is also offered for Windows x86/x64 and Windows ARM64.
That ongoing maintenance matters for a sensor utility because new hardware frequently introduces identifiers, sensors, and telemetry that older monitoring software may not understand correctly. Keeping HWMonitor current is therefore particularly worthwhile after moving to recently released PC components.
HWMonitor remains a useful Windows utility because it concentrates on one job and continues to receive hardware-support updates. The free edition should be sufficient for most people who need straightforward temperature, fan, clock, power, and system-sensor monitoring, while HWMonitor PRO is better suited to users who need remote systems, tray integration, or expanded logging features. Its readings still need sensible interpretation, especially when a value looks abnormal, but for checking PC thermals and observing hardware behavior without a complicated management suite, HWMonitor remains a practical option.
How to Download and Install HWMonitor on Windows
HWMonitor is distributed by CPUID in more than one form. Windows x86/x64 users can choose between the regular setup package and a ZIP version that can be run as a portable application. CPUID also lists Windows ARM64 support. Use the verified download button on this page and select the distribution appropriate for your Windows device.
How to Download HWMonitor
Select the Download for Windows button on this page.
Continue to the verified HWMonitor download source.
Choose the appropriate package for your Windows system.
For a conventional Windows installation, select the official setup package.
If you prefer portable use, select the official ZIP package instead.
Save the downloaded file to a folder where you can easily find it.
CPUID currently lists HWMonitor 1.67 for Windows x86/x64 and separately identifies Windows ARM64 as a supported platform. Do not obtain modified installers or repackaged versions from unverified download sites.
How to Install HWMonitor
Open the HWMonitor setup file you downloaded from the verified source.
If Windows displays a User Account Control request, confirm that the application you opened is the expected HWMonitor installer before continuing.
Review the installation information and available options presented by the setup program.
Complete the installation using the options appropriate for your PC.
Launch HWMonitor after setup finishes.
Expand the detected hardware entries to view the sensor information available from your system.
HWMonitor does not need an elaborate first-time configuration for its core purpose. Once opened, it detects supported monitoring hardware and presents the available readings in its main interface.
How to Download and Run the Portable Version
Choose the official ZIP distribution instead of the setup package.
Save the archive to a suitable location on your PC.
Extract the contents of the ZIP file into a folder.
Keep the extracted folder in a permanent location if you intend to use HWMonitor regularly.
Open the HWMonitor executable from the extracted files.
The portable option is useful when you want hardware monitoring without a conventional software installation. It can also be convenient for technicians who need to check sensor information on more than one Windows PC.
HWMonitor Pros & Cons
- Broad hardware sensor monitoring: HWMonitor can display temperatures, voltages, power, current, utilization, fan speeds, and clock speeds when the relevant sensors are exposed by the hardware.
- Useful component coverage: It can monitor CPUs, GPUs, compatible motherboard monitoring chips, memory modules with thermal sensors, S.M.A.R.T. data from SSDs and hard drives, batteries, and other supported devices.
- Free standard edition: The non-PRO edition provides the core hardware-monitoring functionality without requiring a HWMonitor PRO license.
- Installer and portable choices: CPUID offers both a standard setup package and a ZIP version for Windows x86/x64, giving users the choice between a conventional installation and portable use.
- Actively updated for newer hardware: HWMonitor continues to receive compatibility updates. Version 1.67, released on July 31, 2026, added support for additional power supplies, NZXT cooling hardware, AMD Radeon RX 9050, and NVIDIA GPU Crossbar clock reporting.
- Modern monitoring tools: Recent releases added real-time graphs and CSV logging, making it easier to observe changing sensor values and retain measurements for later analysis.
- Sensor availability depends on the PC: HWMonitor can only report measurements that compatible hardware and its monitoring interfaces expose, so different systems may show different sets of readings.
- Readings still require interpretation: A high temperature, unusual voltage, or unexpected fan value is useful diagnostic information, but it does not automatically identify the cause of a hardware problem.
- Advanced remote features require HWMonitor PRO: Remote PC monitoring, tray sensor displays, editable sensor labels, and more advanced graph-generation features belong to the separate PRO edition.
- Focused rather than automated: HWMonitor observes hardware conditions but does not automatically repair cooling problems, tune fan curves, optimize performance, or replace dedicated stress-testing and diagnostic tools.
Frequently Asked Questions
What is HWMonitor?
HWMonitor is a Windows hardware-monitoring utility developed by CPUID. It reads health and operating information reported by compatible PC sensors, including temperatures, voltages, fan speeds, power, utilization, currents, and clock frequencies. It is mainly useful for checking thermals, observing hardware behavior under load, and gathering information when troubleshooting a desktop or laptop.
Is HWMonitor free?
Yes. The standard edition of HWMonitor is available as a free hardware-monitoring application. CPUID also offers HWMonitor PRO as a separate product with additional features such as remote monitoring, system-tray sensor displays, editable labels, and more advanced logging tools. The underlying hardware-monitoring capabilities are the same according to CPUID.
Does HWMonitor work on Windows ARM PCs?
Yes. CPUID currently lists HWMonitor support for both Windows x86/x64 and Windows ARM64. This makes the utility relevant not only to conventional Intel- and AMD-based Windows PCs but also to compatible Windows on ARM systems. Use the package intended for your system architecture when CPUID presents architecture-specific downloads.
Can HWMonitor control my PC fans?
HWMonitor is primarily a monitoring utility rather than a fan-control application. Its role is to display available fan-speed and other sensor readings from supported hardware. If you need to change fan curves or cooling behavior, use controls provided by your motherboard firmware or a compatible hardware-management utility designed for that purpose.
What is the difference between HWMonitor and HWMonitor PRO?
Both editions use the same core hardware-monitoring capabilities. HWMonitor PRO adds remote monitoring of PCs and Android devices, system-tray sensors, editable sensor labels, and additional logging and graph-generation features. These extras are mainly useful for people managing multiple machines or needing more advanced monitoring workflows.
How accurate is HWMonitor?
HWMonitor reads data reported by the sensors and monitoring controllers built into your PC hardware, so its accuracy depends partly on the component, sensor implementation, and system support. For commonly supported hardware, readings can be useful for monitoring temperatures, fan speeds, voltages, clocks, and power behavior. However, an unusual or implausible value should not be treated as definitive on its own. When troubleshooting an important hardware issue, compare the reading with your motherboard firmware, manufacturer utility, or another reputable monitoring tool.